

Our Verdict
Screen time tracking tools are genuinely useful for building awareness around device habits, but they measure quantity rather than quality. The numbers tell you how much time you spent — not whether that time was wasted, productive, or somewhere in between. Treating the data as one input among many, rather than a definitive score, leads to far more useful insights.
Anyone curious about their digital habits who wants a factual starting point for reflection, not a rigid prescription.
What Screen Time Tools Actually Measure
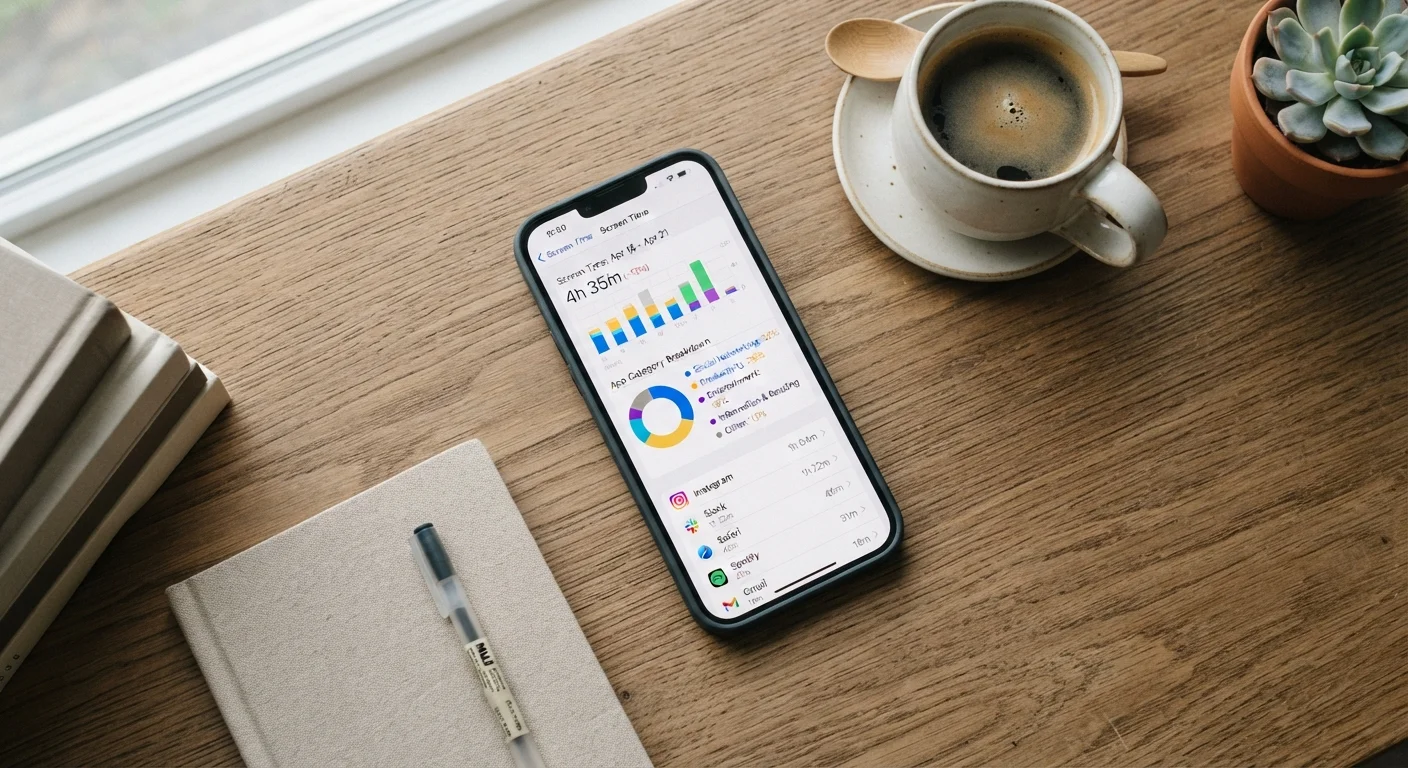
Every major smartphone platform — Apple's iOS and Google's Android — now ships with built-in screen time dashboards. Apple calls its feature Screen Time; Android offers Digital Wellbeing. Both track roughly the same things: total device usage by hour and day, time spent in individual apps, how often you pick up your phone, and how many notifications you receive.
The data is real, and for many people, seeing it for the first time is genuinely surprising. Most users underestimate how frequently they unlock their phones or how many minutes accumulate across fragmented app sessions. In that sense, these tools do something valuable: they make an invisible behavior visible.
But the numbers describe duration only. A tracking tool cannot distinguish between a 30-minute video call with a family member and 30 minutes of impulsive feed-scrolling. It records both as identical — half an hour on the same app.
Screen Time ≠ Screen Harm
Neither Apple Screen Time nor Android Digital Wellbeing makes any judgment about whether your usage is healthy or harmful — they only record duration and frequency. The interpretation is entirely up to you. Researchers studying digital well-being generally agree that the relationship between screen time and outcomes like mood or sleep is more nuanced than simple totals suggest, and that the type and context of use matters considerably.
The Genuine Advantages of Tracking
Creates immediate, concrete awareness of usage patterns
Seeing aggregated data often reveals habits users didn't consciously notice, such as how many times a day they unlock their phone or how late they use it.
Supports intentional limits without external accountability
App timers and downtime schedules give individuals a practical tool to set boundaries on their own terms, adjustable at any time.
Tracks notification volume as a proxy for distraction
The number of notifications received is an underused metric; high counts often correlate with fragmented attention throughout the day.
Useful for families managing children's device access
Parental controls tied to screen time data allow caregivers to set category-level limits that automatically pause specific apps after a set period.
Awareness alone carries real value. Research in behavioral science consistently shows that people make different choices when they can see the consequences of their habits reflected back at them. A daily summary that shows three hours on short-video apps may prompt a person to reconsider how they're spending idle moments in ways that no amount of advice from others could.
Screen time tools also support accountability without requiring outside help. Parents can set usage limits for children, and individuals can create app-specific downtime windows — practical guardrails that are easy to adjust. If you're trying to reduce habitual phone checking, the "pickups" metric is particularly telling: it shows not just total time, but how fragmented your attention has become across the day.
Where the Metrics Fall Short
Duration metrics ignore context and intent entirely
A productive video call and aimless scrolling log identically; the tool has no way to weight usage by purpose or outcome.
Passive and active use are indistinguishable
Background media playing, accidental app opens, and deliberate focused use all add to the same total, inflating numbers without reflecting real engagement.
Multi-device usage is rarely captured in one place
Laptops, tablets, smart TVs, and gaming consoles typically aren't included in a phone's screen time summary, leaving a significant portion of digital time unaccounted for.
High totals can be misleading without category context
Someone who uses their phone heavily for work communication or navigation may show higher numbers than someone whose usage is purely passive entertainment — with very different implications.
Metrics can foster anxiety rather than constructive change
For some users, weekly reports become a source of guilt rather than a useful prompt, particularly when the numbers don't account for legitimate or healthy device use.
The most significant gap in screen time data is context. Duration doesn't capture intent, emotional state, or outcome. Reading a long-form article, navigating public transit with a maps app, and compulsively refreshing a news feed all register as screen time — yet these experiences differ substantially in terms of mental engagement and well-being.
There's also a passive-versus-active blind spot. Watching an educational documentary and leaving a YouTube autoplay running overnight both add to your totals. The tracker has no mechanism to distinguish deliberate viewing from ambient background use.
Accuracy has limits too. Screen time tools typically don't count use across all device categories equally — time on a laptop, smart TV, or gaming console usually isn't captured by your phone's dashboard. This means the data often represents a fraction of total digital engagement. For a fuller view of how technology shapes your daily life, it's worth thinking beyond any single device, much like understanding how your broader digital footprint accumulates across platforms over time.
Finally, there's the risk of misinterpreting the data itself. High screen time isn't automatically harmful; low screen time isn't automatically healthy. Context, purpose, and individual circumstance all matter — factors that a usage dashboard simply cannot weigh.
Using the Data More Effectively
~4 hrs
Average daily smartphone use among US adults
Data analytics firms tracking app usage have consistently reported average daily smartphone engagement in the three-to-four-hour range for US adults, with wide individual variation.
80+
Average daily phone pickups per user
Studies analyzing device unlock behavior suggest most smartphone users check their phones more than 80 times per day, often in sessions lasting under a minute.
Rather than treating your weekly screen time report as a pass-or-fail score, consider it a behavioral log worth interrogating. Start by looking at which apps are consuming the most time and asking whether that use felt intentional. Apps that consistently rank high without a clear purpose are more worth addressing than high totals driven by work calls or navigation.
The pickups and notification counts are often more actionable than total time. Frequent, brief phone checks tend to fragment attention more than longer, deliberate sessions. Reducing notifications — rather than fighting willpower — often produces faster results than setting blunt app limits. This connects to broader patterns around everyday tech habits that shape how you experience your devices without you necessarily noticing.
It's also worth thinking about what the tools don't show. Algorithms on social and video platforms are designed to extend your session — understanding how those systems work can help you interpret why certain apps appear in your top-usage list week after week.
Screen time data is most useful when it prompts a question rather than delivers a verdict. The number itself tells you where to look; only you can determine what it means.
The content on this site is for informational purposes only and is not a substitute for professional advice. Always consult a qualified professional for guidance specific to your situation.